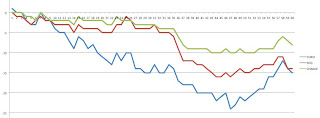
I didn't watch this game, but NHL.com has set itself up in such a way that I hardly needed to. All you truly need is the play-by-play feed and a handy spreadsheet, and you can plot the game on a graph complete with momentum changes and scoring chances.

The blue line represents the flow of 'Corsi' which simply means the total number of shots, misses and blocks for each team. What's charted is the difference. A positive value benefits the road team and a negative value benefits the away team. Corsi is, if nothing else, indicative of puck possession throughout the game (on a minute-to-minute basis, 1-through-60 on the x-axis). You can see that Calgary controlled most of the game from this. The red line represents shots on goal the same way, and the green line does the same for scoring chances, as compiled by Kent Wilson over at Flames Nation.
You can look at the graph after the game and say "oh, well, Calgary dominated, and it showed up on the scoreboard," but that wasn't always the case in this game. The difference was really a Flames outburst at the 36th minute of play, where they scored three goals in 57 seconds.
At the 35th minute, Calgary had a possession advantage of 20%, but a stray shot from Toronto could have put them in the lead, making our graph statistically irrelevant.
But, while possession stats are cool to look at and good to use when judging the play of a player, what really matters when assessing team performance is how well a team is shooting. A blocked or a missed shot typically falls upon the responsibility of the guy shooting the puck, so it's important for us to be able to track just how well a player is shooting. I talked about shooter efficiency earlier this week, but the easiest number to use is simply shots on goal divided by total attempts.
A good, sustainable shooting percentage is in the 52.5% to 57.5% range. If a team doesn't have the puck for very long, but is managing to get a lot of shots with the possession they do have, they're a more dangerous team than one who are missing a lot or having a lot of attempts blocked.
Though Calgary was dominating the possession early, they weren't getting a lot of shots on net. Indeed, after 20 minutes, both teams were under 40%. The Leafs typically do keep possession close, but they're a bad shooting team, so the low number wasn't as unsustainable as Calgary's. Toronto failed to put away their chances, and, once Calgary brought their shooting numbers up (they were 53% in the second and third periods) there wasn't really an escape for the Leafs, and, chinsy goaltending aside, they probably weren't going to stick around with playing a little better.
I'm sure it's all just coincidence that Calgary took the lead when just a minute after they held an advantage in shooting percentage, but the way they shot the puck in the third period, at 56% to Toronto's 38%, makes me think that, had the score stayed tied at 1 through the intermission, Calgary would have eventually taken a scoring advantage.
No comments:
Post a Comment